Stop Rebuilding The Same Report Every Month
Someone in your business spends days each month copying numbers between systems into a spreadsheet nobody fully trusts. That entire job can be automated — live, accurate, and delivered to your inbox before you ask for it.
- Every source in one live view
- Scheduled to your inbox
- AI summary in plain English
If any of this is true right now, this page is for you
Reporting eats days every month
Exports from four systems, pasted into a spreadsheet, formatted by hand. By the time it is finished the numbers are already stale.
Nobody trusts the numbers
Two people produce different totals for the same month because they pulled from different places with different filters.
You find out too late
A problem that started in week one surfaces in a report at the end of the month. Four weeks of damage you could have stopped.
Automated Reports & Dashboards, delivered properly
Not a vague scope and a surprise invoice. This is exactly what is produced and handed over.
Data Source Connections
Google Ads, Meta, GA4, your CRM, Shopify, Razorpay, Tally, spreadsheets and databases pulled into one place automatically.
Live Dashboards
A single screen showing what actually matters — sales, leads, spend, cost per acquisition, pipeline, operations — updating on its own.
Scheduled Reports
Daily, weekly or monthly reports delivered to email or WhatsApp automatically, so nobody has to remember to produce them.
AI Written Summaries
A short plain-English commentary on each report explaining what changed and what is worth attention, rather than leaving you to interpret charts.
Threshold Alerts
Immediate notification when cost per lead rises, stock falls, a target slips or revenue drops — so problems surface in days, not months.
Role-Based Views
Different dashboards for the owner, the sales team and operations, so everyone sees their numbers and not a wall of irrelevant ones.
No hidden extras
Everything listed here is part of the base engagement — not an upsell discovered halfway through the project.
- Data source audit & connection
- KPI definition workshop
- Live dashboard build
- Scheduled report automation
- AI summary generation
- Alert threshold setup
- Mobile-friendly views
- Training & documentation
Four steps, no mystery
You always know what stage we are at, what is next, and what I need from you.
Decide what matters
The six to ten numbers that actually drive decisions. Dashboards fail by showing everything, which is the same as showing nothing.
Connect the sources
Every system connected through APIs or scheduled exports, with one agreed definition for each metric.
Build & verify
Dashboard built and every number reconciled against the source system, because a dashboard that is wrong once never gets trusted again.
Automate & train
Scheduled delivery, alerts and AI summaries configured, then your team trained on reading and extending it.
A closer look at the service
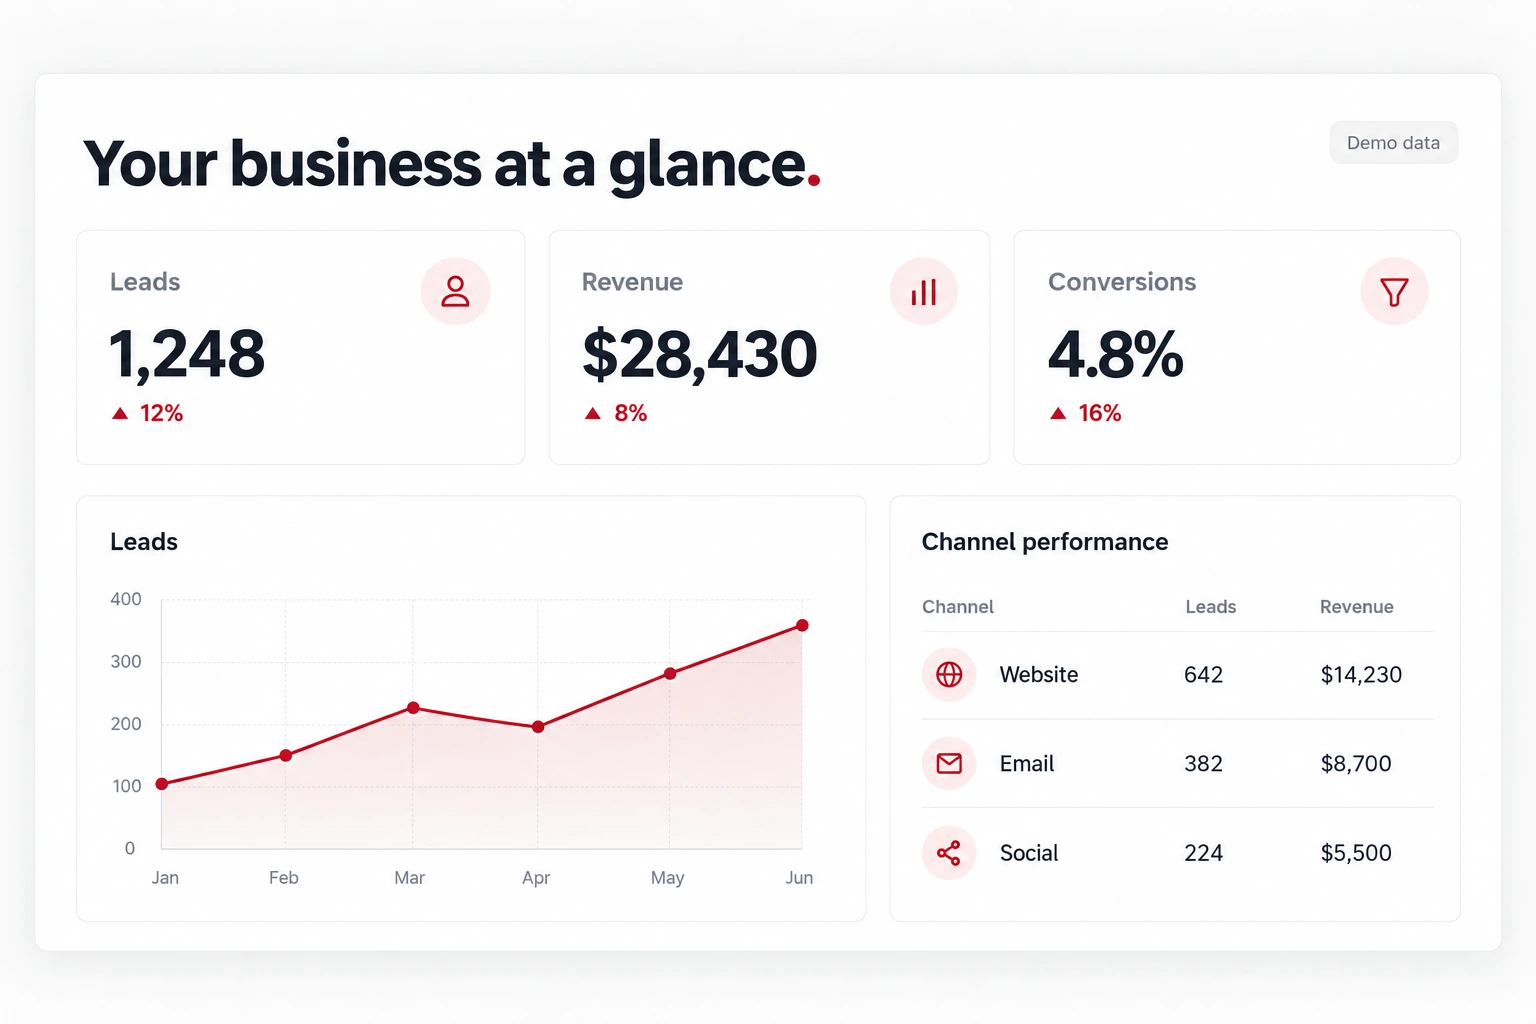
A visual example of the service. Actual project samples are available during your consultation.
What makes this different
Metrics defined before building
Most dashboard projects fail because nobody agreed what a lead or a sale means. That conversation happens first.
Numbers reconciled to source
Every figure is verified against the originating system. Trust is binary — one wrong number and the dashboard is abandoned.
Alerts, not just reports
A report tells you what happened. An alert tells you while you can still do something about it.
Plain English summaries
An AI commentary on each report means it gets read by people who do not enjoy charts.
Pick the scope that fits
Every project is quoted after a short conversation, so you pay for the scope you need and nothing you do not.
Single Dashboard
Best for: One area of the business
- Up to three data sources
- One live dashboard
- Monthly scheduled report
- Training session
Business Dashboard
Best for: Whole-business visibility
- Everything in Single Dashboard
- All major data sources
- Role-based views
- Alerts & AI summaries
Reporting System
Best for: Teams & multi-location
- Everything in Business Dashboard
- Custom data warehouse
- Automated distribution
- Ongoing maintenance
Not sure which fits? Tell me the problem on a free 30-minute call and I will tell you the smallest thing that solves it.
What you should actually end up with
Days of manual reporting eliminated
One set of numbers everyone trusts
Problems caught in days, not months
Decisions made on current data
Answered honestly
Anything with an API or a scheduled export — Google Ads, Meta, GA4, Shopify, WooCommerce, Razorpay, most CRMs, Tally, Google Sheets and SQL databases. I confirm your specific stack during scoping.
Very common. Part of the build is cleaning and standardising it, and sometimes fixing how data is captured at source. I will tell you honestly if the input needs fixing before a dashboard can be meaningful.
Usually not. Looker Studio is free and covers most businesses well. Paid tools only make sense at larger data volumes, and I will not push you into one you do not need.
Each time a report runs, the data is passed to an AI model with context about your business, and it writes a short commentary on what changed and what deserves attention. You review it like any other report.
One to two weeks for a single dashboard, three to four for a full business reporting system. Most of the time goes into connecting sources and verifying numbers, not into design.
Often booked together
Let's talk about your project
A free 30-minute call. You describe the problem, I tell you what it takes, what it costs and whether I am the right person for it.